 TD
TD

A data analyst resume in 2026 needs to prove more than "I know Excel and SQL." Employers want analysts who can clean messy data, write accurate queries, build dashboards, explain insights, and connect analysis to business decisions.
The data job market is still strong, but it is also more competitive. The U.S. Bureau of Labor Statistics projects fast growth for data-heavy roles such as data scientists and operations research analysts from 2024 to 2034. That demand is good news, but it also means your resume needs to show practical ability, not just course certificates.
Use this guide to write a data analyst resume that is clear for recruiters, readable for ATS software, and strong enough to earn interviews.
If you are new to ATS, start with the ATS score guide, then test your resume with the ATS score checker. You can also use ATS-friendly resume templates if your current format is hard to scan. If you are applying as a beginner, pair this guide with how to get a job with no experience and the first-time resume guide.
Key Takeaways
- A data analyst resume in 2026 must demonstrate practical skills beyond basic knowledge of Excel and SQL, including data cleaning, query writing, and dashboard creation.
- The job market for data-heavy roles is growing, making it essential for resumes to showcase real-world abilities rather than just certifications.
- A clear, ATS-friendly one-page resume structure is recommended, featuring a header, summary, skills, work experience, projects, education, and certifications.
- For candidates without full-time experience, placing projects above work experience can highlight relevant skills and practical application of data analysis.
- A concise, keyword-rich resume summary is crucial, focusing on specific tools, types of analysis, and measurable business improvements.
Best Data Analyst Resume Format for 2026
Use a simple one-page resume if you are a fresher, entry-level candidate, or analyst with less than 7 years of experience.
Best structure:
- Header
- resume summary
- Skills
- Work experience
- projects
- education
- certifications
If you do not have full-time data experience, move projects above work experience. For data analyst roles, strong projects can carry a lot of weight because they prove you can work with real datasets.
Header for a Data Analyst Resume
Your header should be clean and professional:
Riya Mehta Mumbai, India | riya@email.com | +91 XXXXX XXXXX LinkedIn.com/in/riyamehta | github.com/riyamehta | riyamehta.com
Add a portfolio link if it includes dashboards, case studies, GitHub notebooks, SQL projects, or Power BI/Tableau screenshots.
Avoid:
- Full home address
- Photo
- Date of birth
- Decorative icons
- Too many social links
Data Analyst Resume Summary
Your summary should be short, specific, and keyword-rich.
Use this formula:
Data Analyst with experience in [tools] and [type of analysis]. Skilled in [SQL/dashboarding/statistics/data cleaning] with projects or experience improving [business metric].
Example for Entry-Level Data Analyst
Entry-level Data Analyst skilled in SQL, Excel, Python, Power BI, and data visualization. Built analytics projects using sales, marketing, and customer datasets to identify trends, create dashboards, and recommend business actions. Strong foundation in statistics, data cleaning, and reporting.
Example for Experienced Data Analyst
data analyst with 3 years of experience building SQL reports, Power BI dashboards, and customer behavior analysis for SaaS and e-commerce teams. Automated weekly reporting, improved campaign visibility, and reduced manual analysis time by 40%.
Do not write:
Hardworking data analyst seeking an opportunity to grow in a reputed organization.
That sentence is too generic and does not help ATS matching.
Data Analyst Skills for 2026
Your skills section should show the tools and concepts employers search for.
Example:
Languages: SQL, Python, R Analytics: Data Cleaning, Exploratory Data Analysis, A/B Testing, Cohort Analysis, Funnel Analysis Visualization: Power BI, Tableau, Looker Studio, Excel Charts Databases: MySQL, PostgreSQL, SQL Server, BigQuery Python Libraries: Pandas, NumPy, Matplotlib, Seaborn, Plotly Spreadsheets: Excel, Google Sheets, Pivot Tables, VLOOKUP, XLOOKUP, Power Query Statistics: Hypothesis Testing, Regression, Correlation, Probability, Descriptive Statistics Business Tools: Jira, Salesforce, Google Analytics, Mixpanel
Only include tools you can discuss in an interview. If you list Python, be ready to explain how you used Pandas for cleaning, grouping, joining, filtering, and visualization.
For more role-based skill examples, read the technical skills in resume guide, then choose the data analytics skills that match your target job.
Best ATS Keywords for Data Analyst Resume
Common ATS keywords for data analyst roles include:
- SQL
- Excel
- Power BI
- Tableau
- Python
- Pandas
- Data visualization
- Dashboard
- Reporting
- Data cleaning
- Data validation
- ETL
- KPI tracking
- Business intelligence
- Exploratory data analysis
- Statistical analysis
- A/B testing
- Forecasting
- Customer segmentation
- Cohort analysis
- Funnel analysis
- Regression analysis
- Stakeholder communication
- Data storytelling
- BigQuery
- PostgreSQL
- MySQL
Do not paste all keywords randomly. Use the words that match the job description and support them with examples.
Weak:
Knowledge of SQL, Excel, Power BI, Tableau, Python, data analysis, dashboards, reporting, statistics.
Strong:
Built a Power BI dashboard using SQL Server data to track revenue, churn, and customer acquisition KPIs, reducing weekly reporting time by 6 hours.
How to Write Strong Data Analyst Resume Bullet Points
Use this formula:
Analyzed + dataset/process + tool/method + business result
Weak Bullet Points
- Worked on Excel reports
- Created dashboards
- Used SQL queries
- Analyzed sales data
Strong Bullet Points
- Built SQL queries to analyze 1.2M transaction records and identify a 17% drop-off in repeat purchases after first order.
- Created a Power BI dashboard tracking revenue, conversion rate, average order value, and churn across 6 business regions.
- Automated weekly Excel reporting with Power Query, reducing manual reporting time from 5 hours to 45 minutes.
- Cleaned and standardized customer data from 4 sources using Python Pandas, improving matching accuracy for CRM analysis.
- Presented customer segmentation insights to marketing stakeholders, helping launch a retention campaign that improved repeat orders by 9%.
Every strong bullet has three ingredients: tool, analysis, and impact.
Data Analyst Resume Example
Here is an example experience section:
data analyst E-commerce Company | Jul 2024 - Present
- Created SQL reports to monitor revenue, refunds, repeat purchases, and category-level performance across 500K+ monthly orders.
- Built Power BI dashboards for leadership teams, improving visibility into daily sales, campaign ROI, and customer retention.
- Analyzed checkout funnel data and identified payment failure patterns that contributed to a 12% cart abandonment increase.
- Automated weekly business review reports with Python and Excel Power Query, saving 8 hours of manual work per week.
- Partnered with marketing and product teams to define KPIs for discount campaigns, customer cohorts, and product launches.
This example works because it shows business understanding, not just technical tool usage.
Data Analyst Project Ideas for Freshers
If you do not have data analyst experience, projects are your proof.
Good project topics:
- Sales dashboard
- Customer churn analysis
- Marketing campaign analysis
- E-commerce funnel analysis
- HR attrition analysis
- Financial expense dashboard
- Netflix or Spotify content analysis
- Credit risk analysis
- Supply chain delay analysis
- Public health dashboard
Strong Project Example
Customer Churn Analysis | SQL, Python, Power BI
- Cleaned and analyzed 50K customer records to identify churn patterns by plan type, tenure, location, and support activity.
- Used SQL joins and window functions to calculate monthly retention, repeat usage, and customer lifetime value.
- Built a Power BI dashboard showing churn rate, high-risk customer segments, and revenue impact.
- Recommended targeted retention actions for annual-plan customers with declining usage.
Another Project Example
Sales Performance Dashboard | Excel, Power Query, Tableau
- Combined sales, product, and region data from 5 CSV files into a clean reporting model.
- Created calculated fields for revenue, profit margin, average order value, and month-over-month growth.
- Built Tableau views for executive summary, region performance, product trends, and sales rep ranking.
- Identified underperforming regions and recommended inventory changes based on demand trends.
Read how to add projects in resume if you want more examples.
If you also want certificates to support these projects, review the best free online certificates for resumes, especially analytics, SQL, Excel, Power BI, and Tableau options.
Certifications for Data Analyst Resume
Certifications can help, especially for freshers, but they should not replace projects.
Useful certifications include:
- Google Data Analytics Professional Certificate
- Microsoft Power BI data analyst certification
- Tableau Desktop Specialist
- SQL certifications
- IBM data analyst Professional Certificate
- Excel or advanced spreadsheet certifications
How to list them:
Google Data Analytics Professional Certificate | Coursera | 2026 Microsoft Power BI data analyst Associate | Microsoft | 2026
If you completed a certification project, add it under projects with details.
Data Analyst Resume for Freshers
freshers should use this order:
- Header
- Summary
- Skills
- projects
- Internship or work experience
- education
- certifications
Your projects should show:
- Real dataset
- Business question
- Cleaning process
- Tool used
- Final insight or recommendation
Example fresher bullet:
Analyzed 100K online retail transactions using SQL and Power BI to identify top customer segments, monthly sales patterns, and products with declining repeat purchases.
This is much stronger than:
Made a sales dashboard project.
Data Analyst Resume for Experienced Candidates
Experienced analysts should focus on business results.
Show impact such as:
- Reduced reporting time
- Improved dashboard adoption
- Found revenue leakage
- Improved campaign ROI tracking
- Increased data accuracy
- Defined KPIs
- Automated manual workflows
- Supported product or business decisions
Example:
Reduced monthly reporting errors by 31% by creating SQL validation checks and standardized KPI definitions across sales and finance dashboards.
This shows both technical and operational value.
Common Data Analyst Resume Mistakes
Mistake 1: Only listing tools
Tools matter, but employers hire analysts for insights. Show what you discovered or improved.
Mistake 2: No SQL proof
SQL is one of the most important data analyst skills. Add SQL projects, SQL reporting, joins, CTEs, window functions, and database experience where relevant.
Mistake 3: Weak project descriptions
"Created dashboard" is not enough. Explain the dataset, KPIs, and recommendation.
Mistake 4: Too many charts, not enough decisions
Dashboards should support business action. Mention the decision your dashboard helped make.
Mistake 5: Ignoring ATS keywords
If the job description says "Power BI, SQL, stakeholder reporting, KPI dashboards," your resume should include those exact terms if you genuinely have them.
Ready-to-Use Data Analyst Resume Template
NAME Location | Email | Phone | LinkedIn | GitHub/Portfolio
SUMMARY data analyst with experience in [tools] and [analysis type]. Skilled in [SQL, dashboards, statistics, reporting] with impact in [business area].
SKILLS Languages: Databases: Visualization: Analytics: Spreadsheets: Business Tools:
EXPERIENCE Job Title | Company | Dates - Analyzed [data/process] using [tool] to improve [metric/result]. - Built [dashboard/report/model] for [stakeholders] tracking [KPIs]. - Automated [workflow] reducing [time/errors/cost].
projects Project Name | Tools - Cleaned and analyzed [dataset] to answer [business question]. - Built [dashboard/report] showing [KPIs]. - Recommended [action] based on [insight].
education Degree | College | Year
certifications Certification Name | Provider | Year
Sources Checked
This guide uses current labor-market context from the BLS Data Scientists Occupational Outlook Handbook and BLS Operations Research Analysts Occupational Outlook Handbook, along with TailorCV ATS resume optimization patterns.
Related Articles
- Product Manager Resume 2026 — Complete Guide with Examples
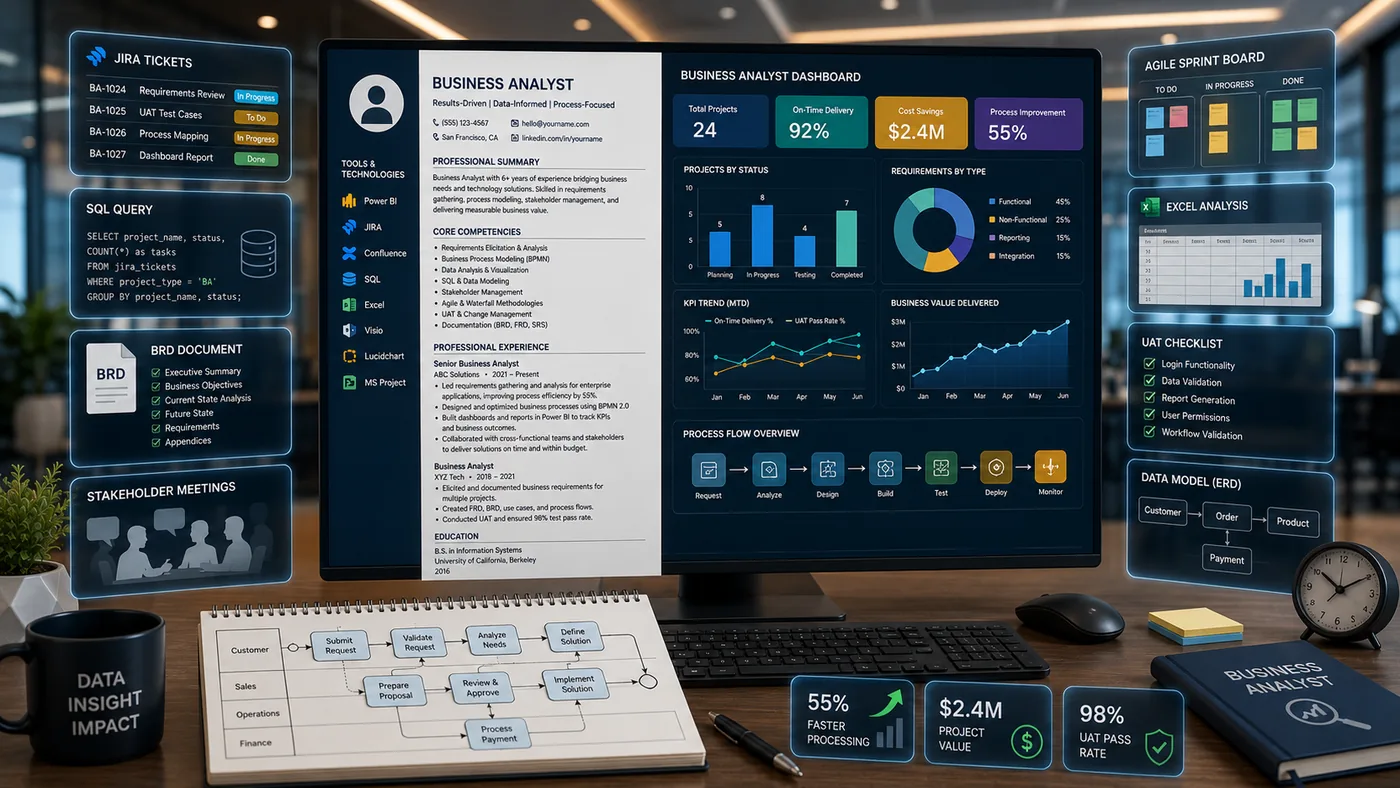
- Business Analyst Resume 2026 — Complete Guide with Examples
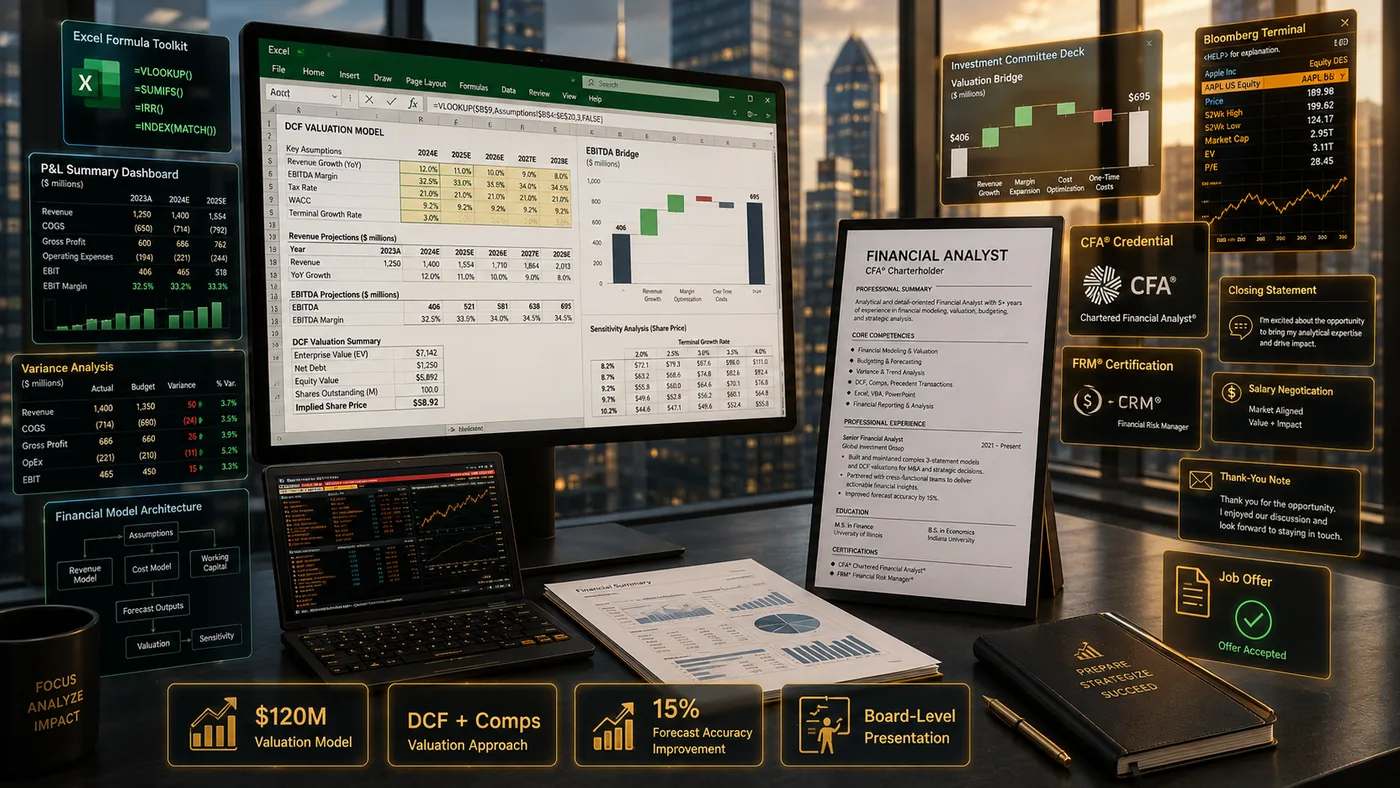
- Financial Analyst Resume 2026 — Complete Guide with Examples
- Marketing Manager Resume 2026 — Complete Guide with Examples
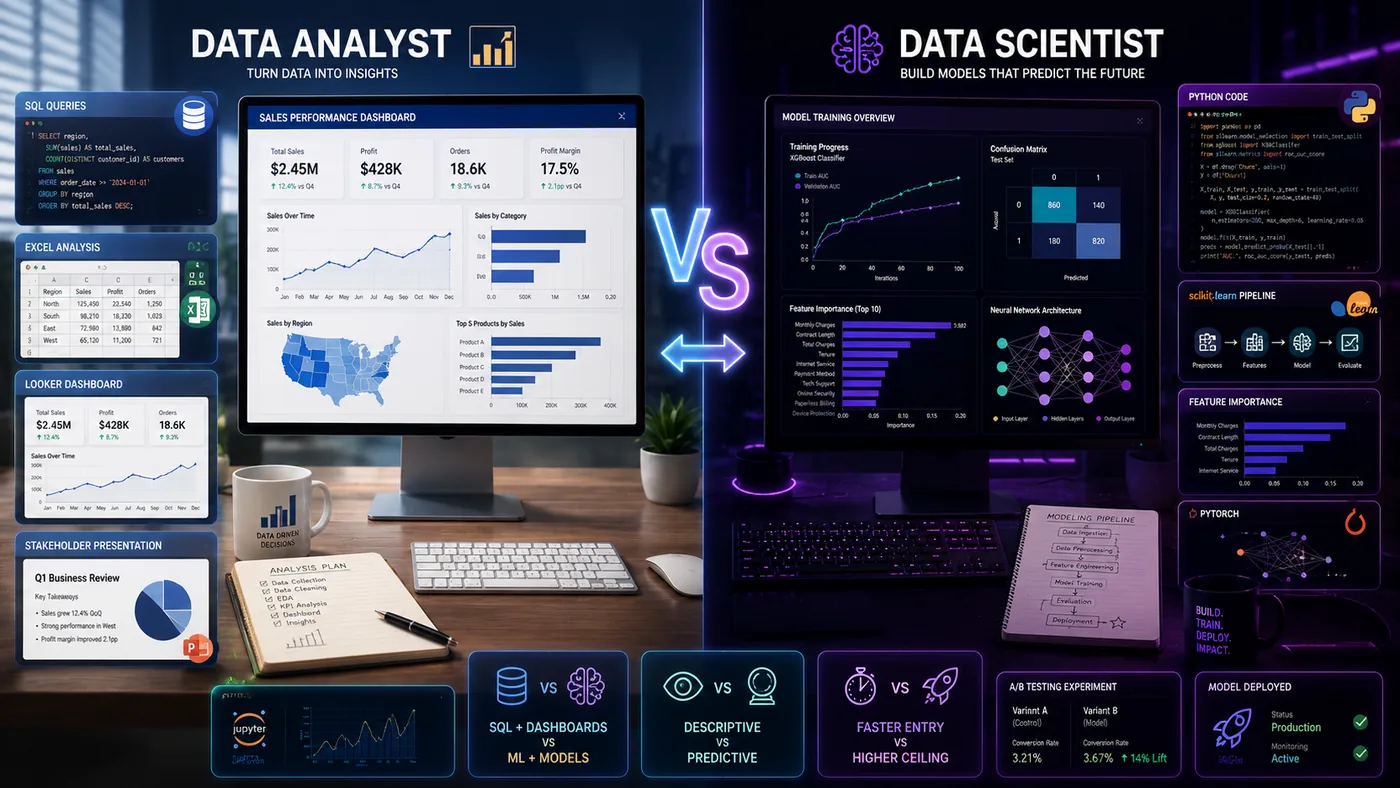
- Data Scientist Resume 2026 — Complete Guide with Examples
- How to Match Your Resume to a Data Analyst Job Description in 2026
- Data Engineer Resume 2026 — Complete Guide with Examples
- How to Tailor Your Resume for Every Job Application (Step-by-Step)
- How to Improve Your ATS Score in 2026
- ATS Keyword Mistakes That Are Costing You Interviews (And How to Fix Them in 2026)
- ATS Mistakes Tech Professionals Make in 2026 (Software Engineers, Data Scientists and Developers Guide)
Make This Practical
Once you draft this resume, test it against a real job post with the free ATS score checker. Then improve fit using Resume Matching With Job Description, polish the layout with ATS-friendly resume templates, and make the bullets stronger with How to Write Resume Bullet Points.
A complete application needs more than one document. Pair the resume with a targeted letter from the AI cover letter generator, practice role-specific questions with the AI mock interview tool, and publish proof of work with the portfolio website builder when your role benefits from projects or case studies.
Conclusion
A strong data analyst resume in 2026 should be clear, practical, and business-focused. Show SQL, dashboards, data cleaning, analysis, and stakeholder impact. Most importantly, prove that your analysis helped someone make a better decision.
Before applying, run your resume through the TailorCV ATS score checker, compare it with the exact job description, and rewrite vague bullets into measurable data impact.
Once your resume is ready, prepare your project explanations using the job interview preparation guide so you can clearly explain dashboards, SQL queries, metrics, and business recommendations.
Frequently Asked Questions
What should I include in my data analyst resume summary for 2026?
Your resume summary should highlight your key skills and experiences relevant to data analysis, emphasizing your ability to derive insights from data and support business decisions. Focus on showcasing your proficiency in tools like SQL, Power BI, and Tableau, as well as any notable projects. For more tips on structuring your summary, check out our Resume Section Order Guide.
How can I make my data analyst resume ATS-friendly?
To ensure your resume is ATS-friendly, use a simple layout with clear headings and relevant keywords related to data analysis. Incorporate terms like "data cleaning," "dashboard creation," and "data visualization" to improve your chances of passing through ATS filters. You can also use our free ATS score checker to evaluate your resume's compatibility.
What are the best projects to include in a data analyst resume?
When listing projects on your resume, focus on those that demonstrate your ability to solve real-world problems using data. Highlight projects where you cleaned data, performed analyses, and presented findings that influenced business decisions. For a deeper understanding of how to structure these projects, refer to our guide on Data Analyst Case Study Portfolio.
How does a data analyst resume differ from a business analyst resume?
A data analyst resume typically emphasizes technical skills in data manipulation and visualization tools, while a business analyst resume focuses more on understanding business needs and requirements. If you're considering a transition between these roles, you might find our Business Analyst Resume 2026 guide helpful for comparing the two.
What format should I use for my data analyst resume in 2026?
For 2026, it's recommended to use a clean, one-page format if you are an entry-level candidate or have less than seven years of experience. The best structure includes a header, resume summary, skills, work experience, projects, education, and certifications. This layout not only improves readability but also helps highlight your qualifications effectively.