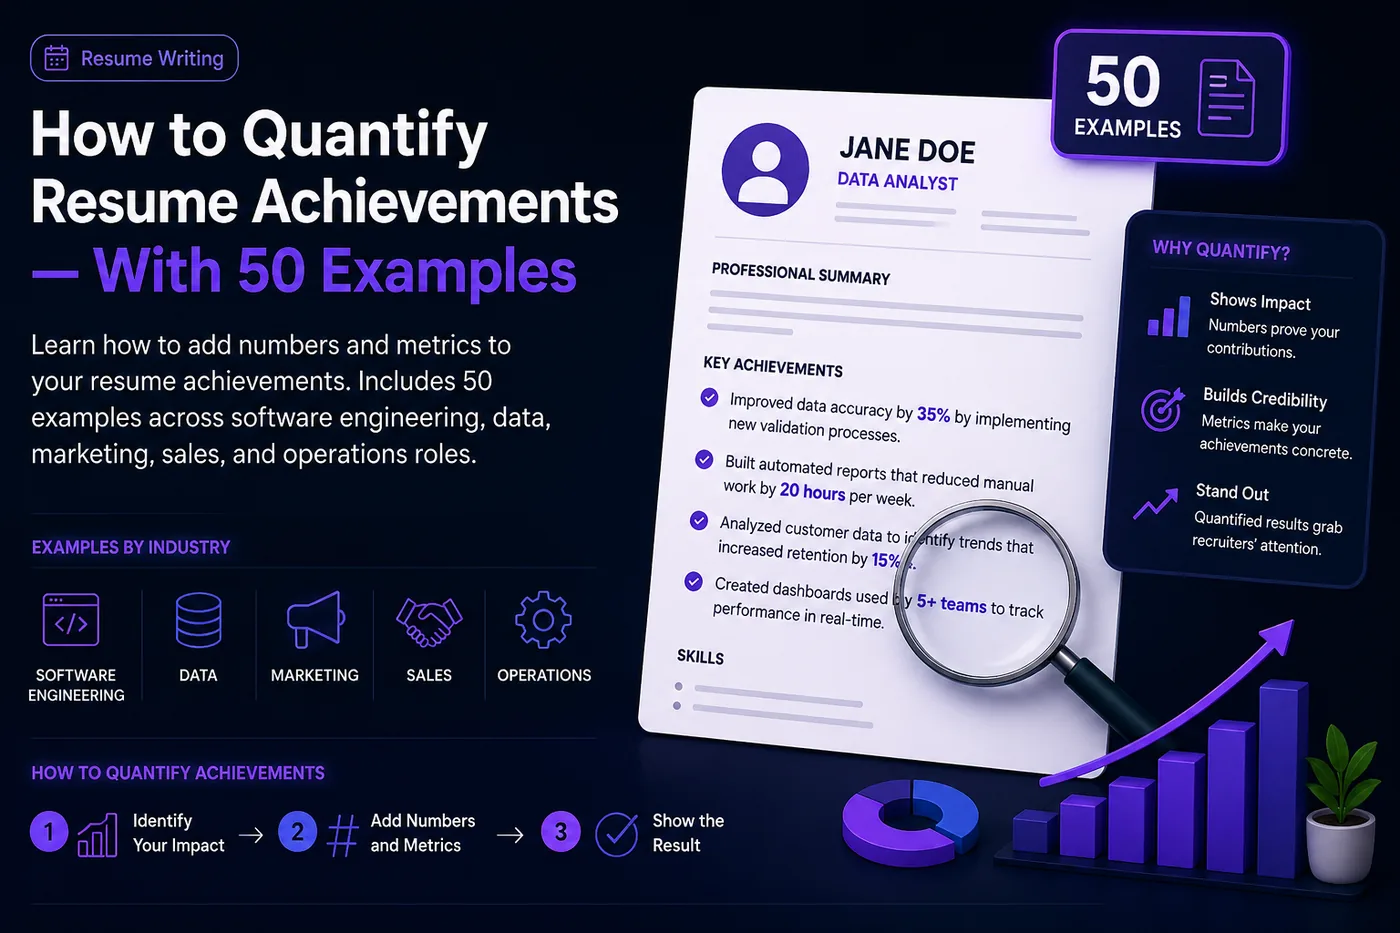
 SS
SS

Key Takeaways
- Numbers are one form of specificity, not the only one, and scope works nearly as well.
- Never invent figures. A fabricated metric fails at interview and costs more than having none.
- Frequency, volume, scale and duration are all quantities you almost certainly know.
- Before and after works without a percentage, describing what changed rather than by how much.
- Concrete beats impressive. A small verified detail outperforms a large vague claim.
The quantities you already have
Measurements that are not performance metrics.
Frequency. How often the work happened — daily, weekly, per release cycle. A report produced weekly is more concrete than a report produced regularly.
Volume. How much you handled — accounts, tickets, records, clients, pages. You usually know this even when nobody tracked outcomes.
Scale. The size of the system, team, budget or audience you worked within, which supplies context for everything else.
Duration. How long something ran or how long it took, which is particularly useful for describing improvements in speed.
Breadth. How many teams, countries, products or stakeholders were involved.
Team size. Both the team you sat in and any group you coordinated, which frames your scope honestly.
And range. Working across three product lines is a quantity, and it says something a single number about output would not.
Describing change without a percentage
Before and after, without invented precision.
| Instead of a metric | Write the change |
|---|---|
| Improved efficiency by X% | Replaced a manual weekly process with an automated one |
| Increased satisfaction | Cut repeat contacts by documenting the top recurring issues |
| Reduced errors | Introduced a review step that caught issues before release |
| Grew the audience | Took the newsletter from an irregular send to a weekly one |
| Improved onboarding | Reduced new-joiner setup from several days to the first morning |
Name the previous state. The contrast does the work that a percentage would otherwise do, and it is entirely verifiable.
Describe the mechanism. How the change happened is frequently more persuasive than its size, because it demonstrates judgement rather than luck.
And use qualitative outcomes honestly. Adopted by the wider team, still in use two years later, and became the standard approach are all real results that no number captures.
Finding the evidence you forgot
Where the concrete detail is hiding.
Old calendars show what you spent time on, which meetings you ran and how often a recurring commitment appeared.
Project folders and shared drives carry dates, filenames and versions that reconstruct a timeline you no longer remember.
Performance reviews are the richest source available, because someone else described your work in specific terms and frequently attached figures.
Handover documents you wrote when leaving a role are effectively a summary of your own scope.
Email and message archives locate the moment something launched, which fixes dates and outcomes precisely.
Former colleagues remember things you do not, and asking one what you were known for produces surprisingly usable material.
And your own old resumes contain detail you cut and then forgot, which is one more reason to keep every version rather than overwriting.
Where fabricated numbers fail
The specific ways an invented figure collapses.
The follow-up question. An interviewer asking how you measured it exposes a number that was never measured, and the discomfort is visible.
The implausible ratio. A figure disproportionate to the team size or timeframe reads as false to anyone who knows the domain.
The suspicious roundness. Improved efficiency by exactly fifty per cent, repeated across several bullets, signals estimation rather than measurement.
The reference check. A former manager describing your role differently from your resume is a difficult contradiction to explain.
The internal inconsistency. Two bullets implying different team sizes or timelines for the same period undermine both.
And the cost is disproportionate. A missing number is a minor weakness; a discovered fabrication ends the process and sometimes the relationship with that employer permanently.
Which is why scope and mechanism are the better answer. They are specific, they are entirely defensible, and they demonstrate the same thing a metric would.
Mini checklist
- unchecked: Frequency stated where work was recurring
- unchecked: Volume included where you handled quantity
- unchecked: Scale of system, team or budget named
- unchecked: Duration used for speed improvements
- unchecked: Previous state described for any change
- unchecked: Mechanism explained, not just the outcome
- unchecked: Qualitative results included where genuine
- unchecked: No figure included that you cannot defend
Scenarios
Scenario 1: Your employer never measured anything
Use volume, frequency and scale, all of which you know from experience. Describe changes by naming what things were like before and what they became.
Scenario 2: You know the number but cannot share it
Use a relative description or a range. Reduced processing time by more than half is usable where the underlying figure is confidential.
Scenario 3: Your contribution was part of a larger result
State the team outcome and name your specific part in it. This is honest, and a clearly bounded contribution to a real result reads better than an unbounded claim.
Tip: Ask yourself what someone would have noticed if you had stopped doing the work for a month. The answer is almost always concrete, and it converts directly into a bullet that needs no metric at all.
Do's and Don'ts
Do
- Use frequency, volume, scale and duration
- Describe the state before the change
- Explain the mechanism of an improvement
- Include qualitative outcomes that are real
- Use ranges when exact figures are confidential
- Bound your contribution within team results
Don't
- Invent plausible-sounding percentages
- Round a guess into a specific figure
- Claim team results without qualification
- Use vague intensifiers as a substitute
- Assume your work has no measurable dimension
- Leave a bullet entirely abstract
Common Mistakes
- Inventing metrics. They collapse under a single follow-up question.
- Assuming no numbers exist. Volume and frequency almost always do.
- Vague intensifiers. Significant and substantial carry no information.
- Omitting the before state. It is what makes a change legible.
- Unbounded team claims. They read as inflation.
- Precision you cannot defend. A false decimal is worse than a range.
Related Guides
Keep building on this with the related guides in this series:
- Weak Resume Bullets and How to Fix Them
- How to Rewrite Resume Bullet Points
- How to Prove Skills Without Certificates
- Resume Red Flags Recruiters Notice
- How to Write a Resume Summary
You can also check your resume's ATS score for free, generate a tailored cover letter, or build a portfolio website in minutes.
When you do want a number but never saw the data, estimating impact honestly walks through five methods for building a figure you can defend.
If your numbers are confidential rather than missing, tailoring when most of your work is confidential shows how to anonymise clients and figures.
Frequently Asked Questions
How do I quantify achievements without metrics?
Use frequency, volume, scale, duration and breadth, all of which you know from doing the work. Describe changes by naming the previous state rather than by inventing a percentage.
Can I estimate a number?
Only if you can defend it and you present it as approximate. A fabricated precise figure fails immediately under a follow-up question, which is worse than having no figure.
What if my work genuinely has no output measure?
Describe what would break if you stopped. Reliability, prevention and adoption are real outcomes, and qualitative results that are genuine read better than invented quantitative ones.
How do I handle confidential figures?
Use a relative description or a range. Reduced processing time by more than half conveys the result without disclosing the underlying data.
Is a qualitative achievement weaker?
Not if it is specific. Still in use two years later is concrete and verifiable, while a vague percentage attached to an unclear claim is neither.
How do I describe team achievements?
State the team result and name your specific contribution within it. A clearly bounded part of a real outcome is more credible than an unbounded claim.
Where can I find details I have forgotten?
Old calendars, project folders, performance reviews, handover documents, message archives, former colleagues, and your own earlier resume versions. Performance reviews are usually the richest source.
What happens if I invent a number?
It fails at the follow-up question, and a discovered fabrication ends the process entirely. A missing metric is a minor weakness by comparison, which is why scope and mechanism are the safer answer.
What is your resume scoring right now?
Scan it against a job description and get your ATS match score in about a minute.
Drop your resume here or choose a file
PDF only. Max 2 MB.
We never share your data or use it to train AI models.
Was this guide useful?
Be the first to rate it.