 SS
SS

Key Takeaways
- "Data scientist" covers at least three different jobs, and the interview loop differs sharply between them.
- SQL and applied statistics are tested far more often than advanced machine learning at entry level.
- A product-sense component is standard at consumer companies and surprises candidates who prepared only technically.
- A project with real, messy data outperforms a portfolio of clean-dataset notebooks by a wide margin.
- Analytics-leaning roles are more numerous, less contested and a legitimate entry point to everything else.
The three jobs behind one title
Reading a posting properly is the first skill, because preparing for the wrong one wastes a season.
Data analyst / product analyst. Answering business questions with data. Heavy SQL, dashboards, experiment analysis, and a great deal of communication with people who do not read code. The largest category by headcount, the most accessible at entry level, and the most consistently underestimated by students who think it is a lesser version of data science. It is not — it is the closest to decision-making.
Data scientist, product or analytics flavour. Experiment design, causal inference, metric definition, and modelling in service of product decisions. Overlaps heavily with the analyst role at many companies and with research at others.
Machine learning engineer. Building and deploying models in production. Substantially a software engineering job with modelling attached — pipelines, serving, monitoring, latency. The interview looks much more like a software engineering loop than like a statistics exam.
Research scientist. Novel method development, usually requiring a PhD and a publication record. A different market entirely.
How to tell from a posting. Look at the tools listed and the verbs. SQL, dashboards and stakeholders means analytics. Pipelines, deployment and latency means engineering. Publications and novel methods means research. If the posting lists everything, it is either a small company where you will do all of it, or nobody has thought about it.
What is actually tested
SQL, more than anything else. Joins, aggregation, window functions, and the ability to write a correct query against an unfamiliar schema while talking. This is the highest-frequency technical screen in the whole field and it is the one candidates most often under-practise because it feels less impressive than modelling.
Applied statistics. Hypothesis testing, confidence intervals, p-values and what they actually mean, sample size, and the classic traps — multiple comparisons, survivorship, selection effects. Interviewers probe understanding rather than formulas.
Experiment design. How would you test this change? What is the unit of randomisation, what is the metric, what could confound it, when would you stop? Standard at any company with a product, and frequently the round that decides.
A case or product question. "Engagement dropped eight percent — how would you investigate?" Structure matters more than the answer: segment, form hypotheses, say what data would distinguish them, and prioritise.
Coding. Python or R, data manipulation, sometimes standard algorithms. Heavier for ML engineering roles.
Machine learning fundamentals. Bias and variance, overfitting, cross-validation, why a model might work in testing and fail in production. Depth of understanding beats breadth of algorithm names — being able to explain when you would not use a complex model is worth more than listing ten.
Communication. Explaining a result to a non-technical stakeholder is assessed directly at many companies, and it is the skill that most separates candidates in the final round.
Building a portfolio that works
Most student data portfolios are near-identical and therefore worthless as a differentiator.
What does not help. A notebook on a famous clean dataset. A tutorial reproduced. A model with a reported accuracy figure and no discussion of what it would be used for. Reviewers have seen hundreds and they skim past.
What does. A project where you obtained the data yourself and it was messy. Scraped, collected via an API, assembled from public records. The mess is the point — cleaning decisions, missing values, inconsistent formats and duplicate records are exactly what the job is, and a project that shows them is evidence.
A question worth answering. Not "predict X" but something a person would actually want to know, with a conclusion stated plainly at the top.
Honest evaluation. What the baseline was, why your approach beats it, and where it fails. A project that names its own limitations reads as far more competent than one claiming a high score.
Something deployed or usable, where it makes sense. A small dashboard or an endpoint someone can hit beats a notebook nobody will run.
A README that leads with the finding. Not the installation instructions. What you found, why it matters, how you checked it.
One good project beats five ordinary ones, and it gives you something to be interrogated about in depth — which is what the interview does.
Preparing efficiently
SQL first, and daily. Twenty minutes a day for six weeks on window functions and multi-table joins moves most candidates from a weak screen to a strong one. This is the highest-return preparation in the field.
Then experiment design and statistics. Work through the standard traps until you can explain each one to a non-statistician, because that is the actual test.
Then a case structure. Practise the "metric dropped, why?" question aloud with a partner. Segment, hypothesise, test, prioritise.
Then coding, weighted to how ML-engineering your target roles are.
Practise explaining a result to a non-technical listener. Genuinely practise it, aloud, to an actual person. It is assessed and almost nobody rehearses it.
And read the posting before preparing. Two weeks on deep learning for a role that will test window functions is a common and entirely avoidable misallocation.
Where the accessible roles are
Analytics roles at any company with users. More numerous than data science roles by a wide margin, less contested, and a genuine path — analysts move into data science and product roles routinely.
Non-technology industries. Healthcare, insurance, retail, logistics, manufacturing and government all employ data people at scale and attract a fraction of the applicants that consumer technology does. The work is frequently more interesting than the sector's reputation suggests, because the data is real and messy and the decisions matter.
Universities and research institutes. Substantial data hiring, and — relevant if you need sponsorship — some are cap-exempt.
Mid-sized companies. Where a graduate can own the whole analytics function rather than a slice of it.
Federal agencies and contractors, where statistical and analytical roles are numerous and the applications are unlike private-sector ones.
SQL, at the level actually tested
Since this is the highest-frequency screen in the field, it is worth being specific about what appears.
Joins, including the awkward ones. Inner, left, and the cases where a left join plus a null check is the correct expression of "things that do not have a match". Self-joins. Joining on more than one key.
Aggregation with conditions. Grouping, having, and conditional aggregation — counting only the rows meeting a condition inside a single pass.
Window functions. The dividing line between candidates. Running totals, rank and dense rank, lag and lead, and partitioned aggregates. If you know one advanced thing, know these.
Date handling. Truncating to a period, computing differences, handling months of different lengths. Every real question involves dates.
Cohort and retention queries. Given users and events, compute how many users active in week one were still active in week four. This exact question appears constantly because it exercises joins, dates and windows together.
Deduplication. Given rows with duplicates, keep the most recent per key. A one-line window function and a common stumbling point.
How to practise. Against a schema you have not seen, on a clock, writing out loud. The screen is usually shared and narrated — being able to say "I'll start by getting one row per user per day, then join back" before writing is what is actually assessed.
And check your own query. Say what you expect the output shape to be, then verify it. Interviewers notice, and it is the same instinct that makes someone good at the job.
Experiment design, at interview depth
The round that most reliably separates candidates at product companies, and it is learnable in a weekend.
Start with the decision, not the test. What would you do differently depending on the result? A test whose outcomes do not change anyone's behaviour should not be run, and saying so is a strong answer.
Name the unit of randomisation. User, session, device, or geography. This is the first thing an interviewer listens for, and randomising by session when the effect is per user is a classic error.
Define one primary metric. Plus supporting metrics and a guardrail. Candidates who name six primary metrics are describing a test that cannot fail cleanly and therefore cannot succeed cleanly either.
Address interference. If users interact — a marketplace, a social product, anything with network effects — a naive user-level split contaminates both arms. Recognising this is a strong signal.
Say something sensible about power. You do not need a formula. "We'd need a large enough sample to detect the smallest effect worth acting on, and if that effect is tiny the test may not be worth running" is exactly right.
Say when you would stop. Fixed horizon, decided in advance. Peeking repeatedly and stopping when it looks good inflates false positives, and knowing that is table stakes.
Name what could confound it. Seasonality, a concurrent launch, a novelty effect that fades, a holiday.
And discuss practical significance. A statistically significant 0.2% lift on a huge sample may not justify the maintenance cost. Distinguishing statistical from practical importance is what separates an analyst from a calculator.
Reading the posting, concretely
Since preparing for the wrong role is the most expensive error in this field, here is how to tell them apart in thirty seconds.
Signals it is analytics. SQL named first. Words like dashboard, stakeholder, reporting, business, insight. Metrics and experimentation. Named tools for visualisation. A business team in the reporting line.
Signals it is product data science. Experimentation, causal inference, metric design, A/B testing. Sits with a product team. Statistics emphasised over engineering.
Signals it is machine learning engineering. Pipelines, deployment, serving, latency, scale, monitoring. Named infrastructure tools. Software engineering practices mentioned — testing, version control, CI. Reports into engineering.
Signals it is research. Publications, novel methods, PhD preferred, named research areas, conference names.
Signals nobody has thought about it. Every one of the above in a single posting, plus a request for five years of experience in a graduate role. This usually means a small company where you would do all of it, which can be an excellent first job — just go in knowing that.
What to do with the signal. Prepare the corresponding block from the plan above and skip the others. A candidate who spent six weeks on deep learning and then faced four window-function questions has not been unlucky; they read the posting too quickly.
And ask the recruiter directly. "What does the interview loop look like, and what should I focus on?" is a completely normal question and most recruiters answer it honestly, because they want candidates to pass.
Where entry-level candidates actually lose
Ranked by how often it happens, from the interviewers' side.
The SQL screen. More candidates are removed here than at any other stage. Not because the questions are hard, but because window functions and multi-table reasoning need practice that most degree programmes do not provide.
Talking about models without understanding them. Naming an algorithm and being unable to explain why it suits the problem, or what would make it fail, is transparent within two questions. Depth on three models beats familiarity with twenty.
No sense of the business. Being asked what metric matters for a product and having no view. The technical work is only valuable if it points at a decision, and candidates who never connect the two read as technicians rather than analysts.
Portfolio projects that prove nothing. A model on a clean, famous dataset demonstrates that you can follow a tutorial. Reviewers have seen it hundreds of times.
Ignoring uncertainty. Presenting a result as fact when it is correlational, or quoting a figure to four decimals from a noisy sample. Naming the limitation is what makes the rest believable.
Poor communication under simplification. Being unable to explain a finding without jargon. This is assessed and it decides close calls, and almost nobody practises it aloud with a real listener.
The fix for all six is unglamorous and specific: daily SQL, three models understood deeply, one self-sourced messy project with an honest limitations section, and one rehearsal of explaining your finding to a non-specialist. That is a two-month plan and it moves most candidates from screened-out to competitive.
Explaining results to non-technical people
Assessed directly at many companies, rehearsed by almost nobody, and it decides close calls.
The structure that works. Lead with the answer, not the method. "Users who complete onboarding in one session are about twice as likely to still be here in a month" — then, if asked, how you know.
Quantify without precision theatre. "Roughly twice" is more useful to a decision-maker than "1.94×". Precision beyond what the decision needs signals inexperience.
Name the uncertainty in plain words. "This is correlational — I can't tell you that finishing onboarding causes retention, only that they go together. To separate those we'd need to run a test." That sentence does more for your credibility than any model.
Say what you would do next. A result with no recommended action is an unfinished piece of work.
Drop the vocabulary. No p-values, no confidence intervals, no model names unless asked. If you cannot say it without jargon, you have not finished understanding it.
Practise on a real person. Take a finding from your own project and explain it to a friend outside your field. If they can repeat it back accurately, you are ready. If they nod politely, you are not.
Why it matters more than it seems. At entry level, most data work is only valuable if it changes a decision, and it can only change a decision if a non-specialist understands and believes it. Companies know this, which is why the round exists.
A twelve-week preparation plan
Weeks 1–4: SQL, daily. Twenty minutes every day, progressing from joins and aggregation to window functions, cohort queries and deduplication. Practise against unfamiliar schemas and narrate aloud. This block alone changes most candidates' outcomes.
Weeks 5–6: statistics and experimentation. Hypothesis testing and what a p-value actually says, confidence intervals, sample size intuition, the standard traps, and full experiment design end to end.
Weeks 7–8: the project. Source messy data yourself, answer a real question, evaluate honestly, and write a README that leads with the finding. One project, done properly.
Weeks 9–10: case and metrics practice. The "metric dropped, why?" structure and the "what would you measure?" structure, aloud, with a partner.
Week 11: coding, weighted to how ML-engineering your targets are.
Week 12: communication and mocks. Explain your project's finding to a non-technical person. Do two full mock loops.
Throughout: read each posting before preparing for it, because the three jobs behind the title test different things and preparing for the wrong one is the most expensive error in this field.
The project, worked through
Since one good project outperforms a portfolio of notebooks, here is what a strong one looks like end to end.
Pick a question a person would ask. Not "predict housing prices" — something like "which bus routes in my city are least reliable, and does it correlate with the neighbourhoods they serve?"
Get the data yourself. A public API, a scrape, an open records request. It will be messy, inconsistent and incomplete, and that is the point — those problems are the job.
Document the cleaning decisions. Which records you dropped and why, how you handled missing values, what you did about duplicates and format changes. This section is what an experienced reviewer reads most carefully, because it shows judgement rather than mechanics.
Answer the question simply first. A well-constructed descriptive analysis with clear visualisation frequently beats a model. If you do model, say what your baseline was and why the model beats it.
Be honest about limits. What confounds this, what you cannot conclude, where the data is unreliable. A project that names its own weaknesses reads as far more competent than one claiming certainty.
Write the README finding-first. One paragraph: what you found, why it matters, how confident you are. Installation instructions go at the bottom, if at all.
Make it reachable. A rendered page, a small dashboard, a notebook that displays properly on the web. Nobody will clone your repository.
Then be ready to be interrogated on it. Every decision you made is a question an interviewer can ask, and having real answers is exactly why a self-sourced project beats a tutorial.
Tip: Build one end-to-end project with real, messy data rather than three clean-dataset notebooks. The interview conversation is almost always about the messy parts.
Common Mistakes
- Preparing for the wrong role. Analytics, ML engineering and research have different loops; read the posting.
- Under-practising SQL. Under-practising SQL the single most tested skill and the most neglected.
- A portfolio of clean-dataset notebooks. Indistinguishable from everyone else's.
- Reciting model names. Depth on a few beats breadth across many, and knowing when not to model beats both.
- Ignoring the communication round. It is assessed and it decides close calls.
- Dismissing analyst titles. More numerous, less contested, and closer to decisions than the title implies.
Related Guides
Keep building on this with the related guides in this series:
- 401(k) and Benefits Explained for New Graduates
- US Background Checks - What Employers Actually See
- Cap-Exempt H-1B Employers - The Route Around the Lottery
- Community College Transfer Students - Building a Career Strategy That Works
- Day-One CPT - What It Is and Why It Carries Real Risk
- The I-9 and Employment Verification - What New Graduates Need to Know
- Layoffs and Severance for New Graduates in the US
You can also check your resume's ATS score for free, generate a tailored cover letter, or build a portfolio website in minutes.
Frequently Asked Questions
Should I do a bootcamp or a master's?
Neither is required. A master's helps for research-leaning roles and for international students who want the extra time in-market. A bootcamp adds little that a strong self-sourced project does not, and reviewers weight the project higher.
How important is domain knowledge?
More than students expect. Understanding the business the data describes is what turns an analysis into a decision, and it is why healthcare, finance and logistics data teams value people who take the domain seriously.
What if I only get analyst interviews?
Take them. Analytics work builds SQL fluency, experiment literacy and stakeholder communication faster than many junior data science roles, and the internal move afterwards is routine.
Do I need a master's degree?
Helpful and not required for analytics and many data science roles. Research positions frequently require a PhD. Demonstrated ability with real data substitutes for a great deal.
Which language should I learn?
Python for most industry roles, plus SQL, which is non-negotiable. R remains common in some research, biostatistics and academic settings.
How much machine learning do I need at entry level?
Less than students expect. Solid fundamentals, honest evaluation, and knowing when a simple model is the right answer. Depth in deep learning matters for specific roles and is not the general requirement.
Is a Kaggle ranking useful?
Mildly. It demonstrates modelling skill on clean, well-defined problems, which is the easy half of the job. Interviewers weight a self-sourced messy project higher.
Analyst or scientist for a first job?
Take the analyst role if it is at a company with real data and real decisions. You will learn SQL, experimentation and stakeholder communication faster than in many junior data science roles, and moving across afterwards is routine.
What about international students?
The same employer eligibility questions apply. Note that quantitative degrees are frequently STEM-designated, which matters for the extension — confirm your own programme's classification rather than assuming.
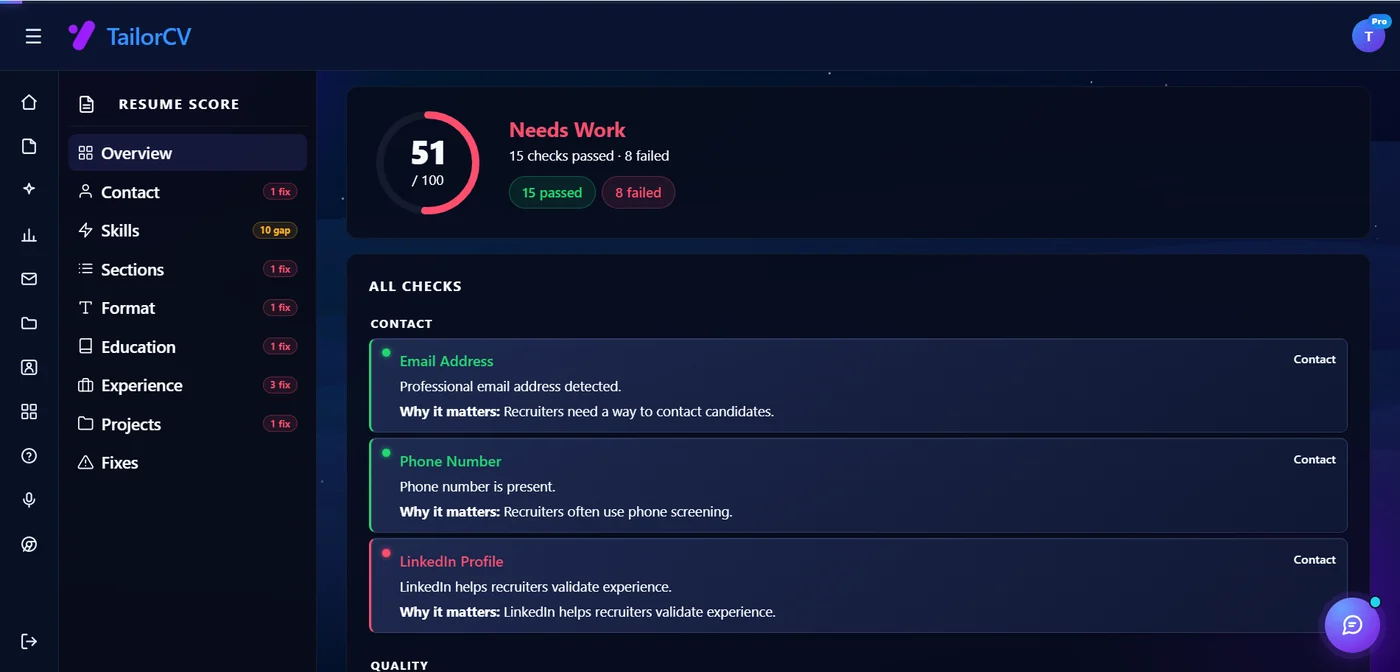
What is your resume scoring right now?
Scan it against a job description and get your ATS match score in about a minute.
Drop your resume here or choose a file
PDF only. Max 2 MB.
We never share your data or use it to train AI models.
See what your portfolio could look like
This theme is built straight from your resume — pick one and your portfolio is live in minutes.
Was this guide useful?
Be the first to rate it.