 TD
Key Takeaways
- A BI analyst resume must show the decision a dashboard changed, not just that the dashboard exists.
- Name the BI tool the ad uses (Power BI, Tableau, Looker) and its parts - DAX, Power Query, LOD expressions, LookML.
- SQL and data modelling (star schema, dimensional modelling) are in nearly every BI job ad. Give them their own bullets.
- Show adoption: how many people use your reports, and what time or money they saved.
A business intelligence analyst resume gets interviews when it connects data work to business decisions. Recruiters scan for the BI tool, SQL depth, data modelling and the impact of your reports. "Built dashboards in Power BI" is a task; "Built a Power BI sales dashboard used by 120 managers that replaced 6 manual Excel reports" is a result.
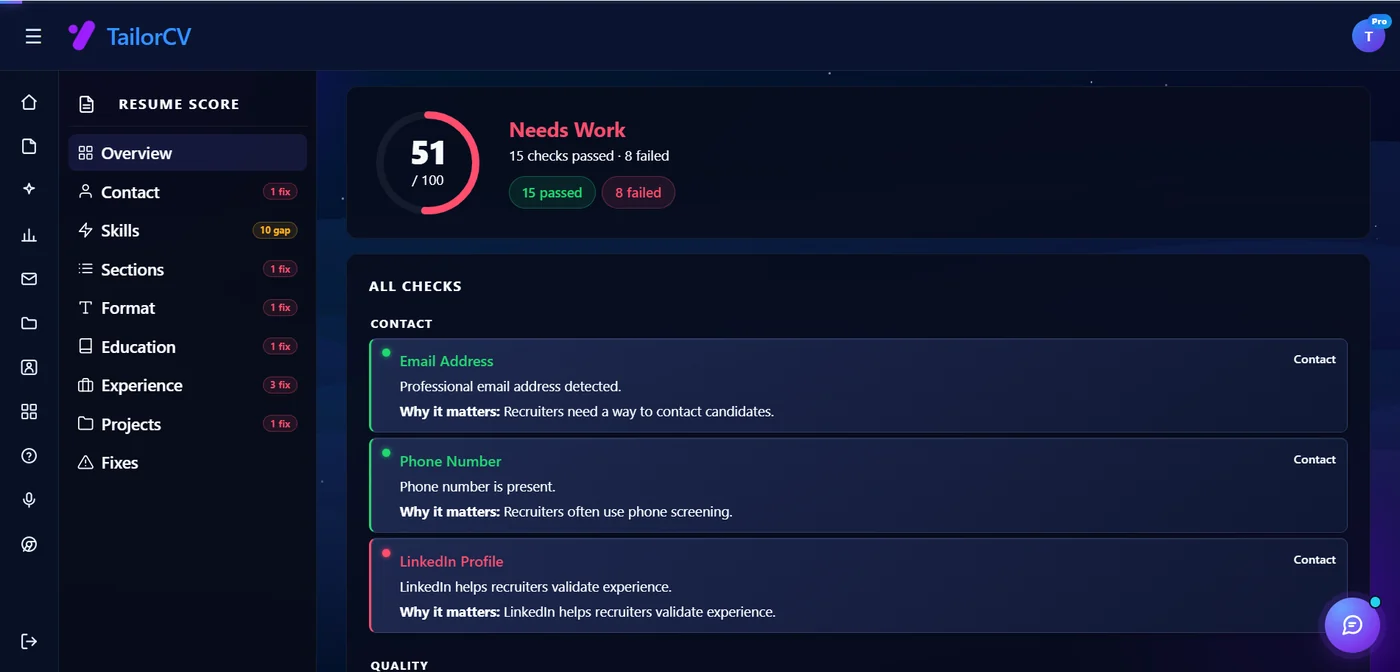
Paste your resume next to a real BI posting in the free ATS score checker to see which tools and skills the ad wants that you haven't mentioned.
What the job ad is really asking for
| Job ad says | What it means for your resume |
|---|---|
| "Develop dashboards in Power BI / Tableau" | Name the tool, the audience and the decision the dashboard supports. |
| "Advanced SQL" | A bullet with complex queries, optimisation or data volume. |
| "Data modelling and ETL" | Star schema, dbt, SSIS, Azure Data Factory - whatever you used. |
| "Partner with business stakeholders" | Who you worked with and what changed for them. |
BI Analyst Resume Summary
Experienced: Business intelligence analyst with 5 years building Power BI and SQL reporting for retail and supply chain teams. Designed a star-schema data model and 14 dashboards used by 300+ managers, replacing 25 hours a week of manual reporting.
Entry-level: Data-focused BI analyst with an MS in Business Analytics and a 6-month internship building Tableau dashboards on 3M-row sales data. Strong in SQL, Excel and Python (pandas).
Skills Section
BI tools:        Power BI (DAX, Power Query, RLS), Tableau (LOD, calculated fields), Looker
SQL & data:      SQL Server, PostgreSQL, Snowflake, BigQuery, window functions, CTEs
Modelling/ETL:   Star schema, dimensional modelling, dbt, SSIS, Azure Data Factory
Analysis:        Excel (Power Pivot, XLOOKUP), Python (pandas), KPI design, A/B analysis
Business:        Stakeholder requirements, data storytelling, reporting automation
Bullet Rewrites
Before: Created Power BI dashboards. After: Built 14 Power BI dashboards on a new star-schema model, used weekly by 300+ store and regional managers to track sales, margin and stock.
Before: Automated reports. After: Replaced 25 hours a week of manual Excel reporting with scheduled Power BI refreshes from Snowflake, freeing 2 analysts for deeper work.
Before: Wrote SQL queries. After: Optimised the nightly sales query from 48 minutes to 6 by rewriting joins and adding clustered indexes on SQL Server.
Before: Supported the business with data. After: Found a $380K/year shrinkage problem in 4 stores through a stock-variance dashboard, leading to a process change that cut losses by 60%.
See how to quantify achievements for finding your numbers.
ATS Keywords for BI Analyst Resumes
Business intelligence, Power BI, Tableau, Looker, DAX, Power Query, SQL, data modelling, star schema, ETL, data warehouse, Snowflake, BigQuery, dashboard, KPI, data visualisation, reporting automation, Excel, stakeholder management, data storytelling.
Use the tool names exactly as the ad writes them - "Power BI", not "PowerBI". Where to place keywords shows where they count most.
Tailoring Walkthrough
- Power BI-heavy ad: lead with DAX, data modelling and refresh automation.
- Tableau-heavy ad: lead with Tableau dashboards and calculated fields, keeping Power BI in skills.
- Data-analyst-style ad: move analysis and insight bullets above tooling - compare with the data analyst resume guide.
The resume optimizer reorders your bullets and skills for each ad automatically.
Common Mistakes
- Listing every chart type you know. Show business outcomes instead.
- No SQL bullet. BI roles are SQL roles - prove it.
- Screenshots of dashboards in the resume. Images break ATS parsing; link a portfolio instead.
- Generic "data-driven" phrasing. Name the decision you informed.
Related Guides
- Data Analyst Resume 2026
- Business Analyst Resume 2026
- Data Engineer Resume 2026
- Financial Analyst Resume 2026
- Resume Matching for Data Analysts
Make This Practical
Check your match with the free ATS score checker, then tailor the resume to each BI posting with the resume optimizer. A portfolio website is a good place for dashboard screenshots.
Frequently Asked Questions
What is the difference between a BI analyst and a data analyst resume?
A BI analyst resume centres on reporting systems - dashboards, data models, automation and adoption. A data analyst resume centres on analysis and insights. Many roles mix both; lead with whichever the job ad stresses.
Should I include a dashboard portfolio?
Yes, if you can share public or anonymised work. Link it in your header rather than adding images to the resume.
Which certification helps a BI analyst resume?
Microsoft PL-300 (Power BI Data Analyst) and Tableau certifications are the most recognised. List them near the top if the ad mentions the tool.
See which keywords you are missing
Scan your resume against the posting and get the exact terms it did not find.
Drop your resume here or choose a file
PDF only. Max 2 MB.
We never share your data or use it to train AI models.
Where those keywords actually go
A layout with a real skills section gives the parser somewhere clean to find every term you just added.